Microsoft Introduces Python Integration to Excel in Hopes that You’ll Hate It Less

A Tutorial for the new Python Integration in Excel
Published on October 13, 2023 by Bethany Blake
python excel anaconda data science technology
6 min READ
Table of Contents
- Introduction
- Easy as PY
- Create a Data Frame
- Libraries
- Clean & Analyze
- Visualize
- Collaborate
- Future for Excel and Data Folks
1. Introduction
When you got hired as a data scientist you didn’t know you would be a one-stop shop for all things data at your company, but here you are. Most days you’re so busy juggling your data analyst and data engineer hats, you wonder what was the point of getting a masters degree in data science. In fact, when the company hired you, they didn’t even have a data pipeline. You’ve bled, sweat, and shed a few tears to build your company’s data workflow from scratch and if you see one more Excel spreadsheet with its archaic, overly complex interface and inferior, tabular data keeping, so help the wayward soul who brings it across your desk.

Enter Sydney from marketing. She’s a really good friend. She’s had your back time and again. Sydney has been working her butt off to put together a big sales report for the next board meeting. She’s pulled out all the stops and applied every skill in Excel she knows for this report. This thing is gorgeous. Multiple tabbed sheets of tables with bolded, colorful headers and thoughtfully placed gridlines, bulleted and italicized key points, conditional formatting, pivot tables, formulas calculating key information, and some helpful hyperlinks for those seeking additional resources. If there was an art gallery for spreadsheets, Sydney’s report would be the showcase. However, 3 days away from the meeting, the Marketing Director has come back and told Sydney that the analytics and graphs just aren’t going to cut it and she needs to tag in the resident data guru, you.
Obviously, you’re not going hang Sydney out to dry, but you’re going to have to hack this report apart to do your thing. It’s a pain but not the most difficult thing in the world to use pandas or an excel reading library to clean and flatten the tabs you need. You could even convert them into CSV files before loading into your favorite Python IDE. But by the time you’re done, it’s going to look nothing like Sydney’s report and whatever you compute is going to have sent back to her and awkwardly added back in. Fingers crossed, she won’t need any adjustments to send back and forth before getting the Marketing Director’s final approval under this eminent deadline.
Realistically though, Sydney’s dataset isn’t a big dataset. It’s a couple thousand lines. It doesn’t need to be handled outside of Excel. However, you need Python to use your core data libraries for cleaning, analytics, and visualization. Microsoft sees you and has collaborated with Anaconda to bring you their new Python Integration in Excel.
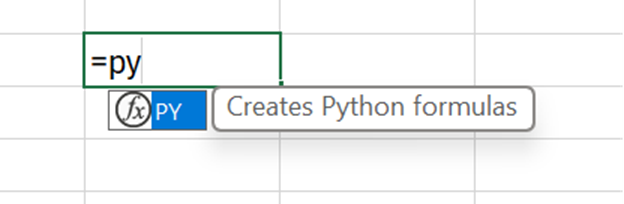
2. Easy as PY
No really, it’s as easy as “PY”. To start using python code in an excel spreadsheet, the user just needs to type “=PY(“. The cell is then converted into a coding block using Python coding syntax.
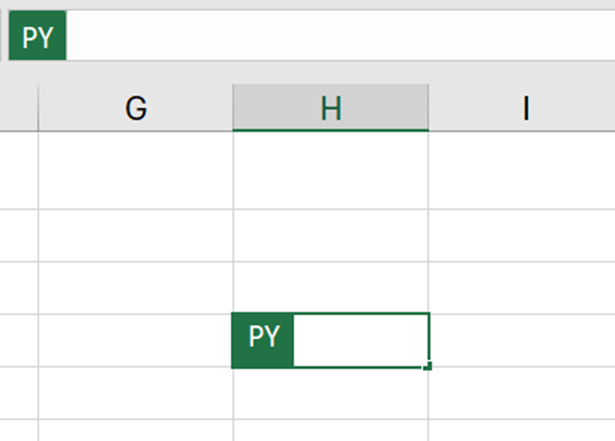
A cell can also be converted to a Python coding block by changing the output of the ribbon from Excel Value to Python Object, and Excel has your back with troubleshooting tips if your code fails to run.
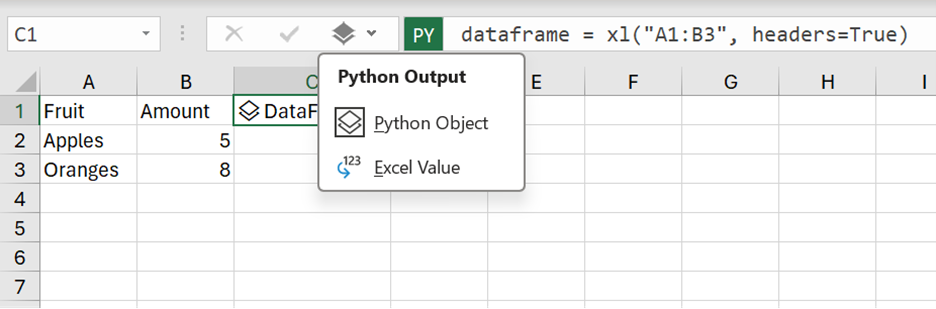
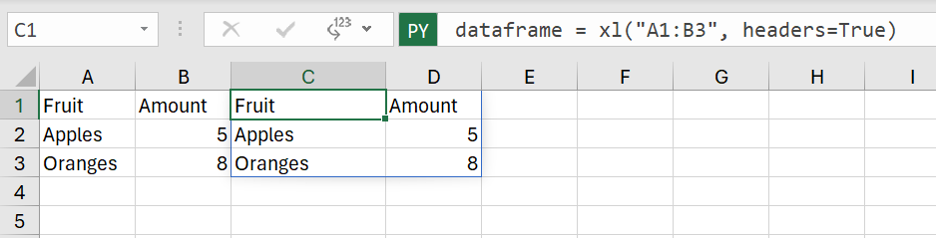
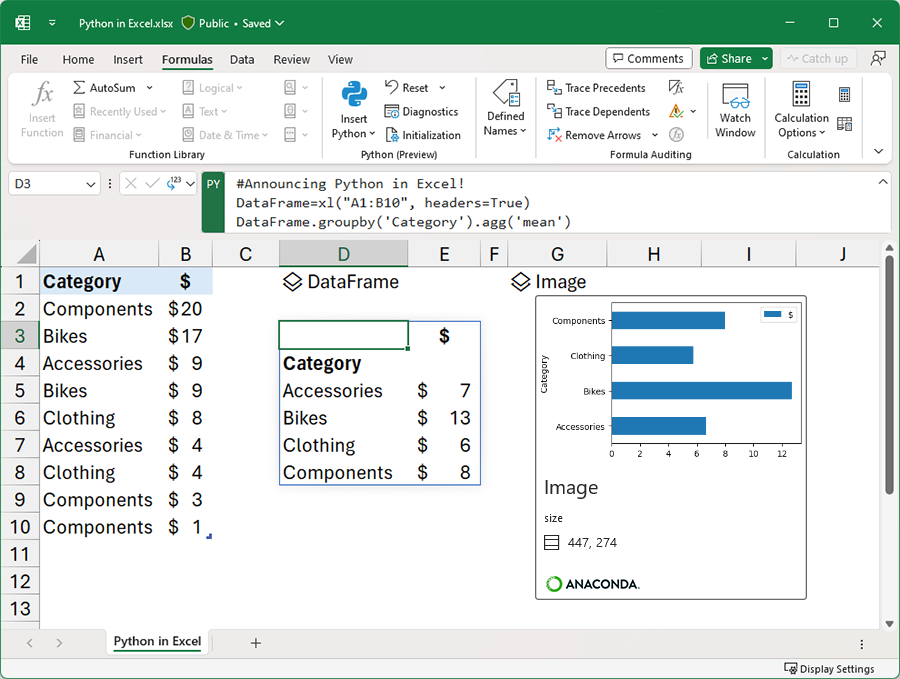
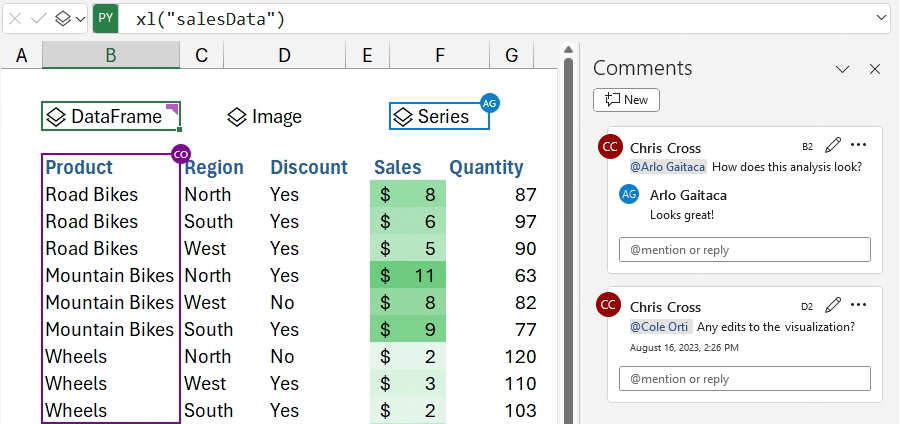
3. Create a Data Frame
After the cell have been converted into a Python coding block, a data frame can be created by selecting the cells containing the block of data to use or by typing the following code in the cell: dataframe = xl( “[replace with cell range]“, headers=True).
4. Libraries
Understanding the power of Python libraries, Excel comes with the following open-source python libraries already loaded into the spreadsheet by default. They’ve been imported with the statements listed.
import matplotlib.pyplot as plt
import numpy as np
import pandas as pd
import seaborn as sns
import statsmodels as sm
In addition to these core libraries, additional libraries available through Anaconda can be imported into the coding block. Importing additional Python libraries into Excel follows standard syntax for python import statements. Example:
import astropy as ast
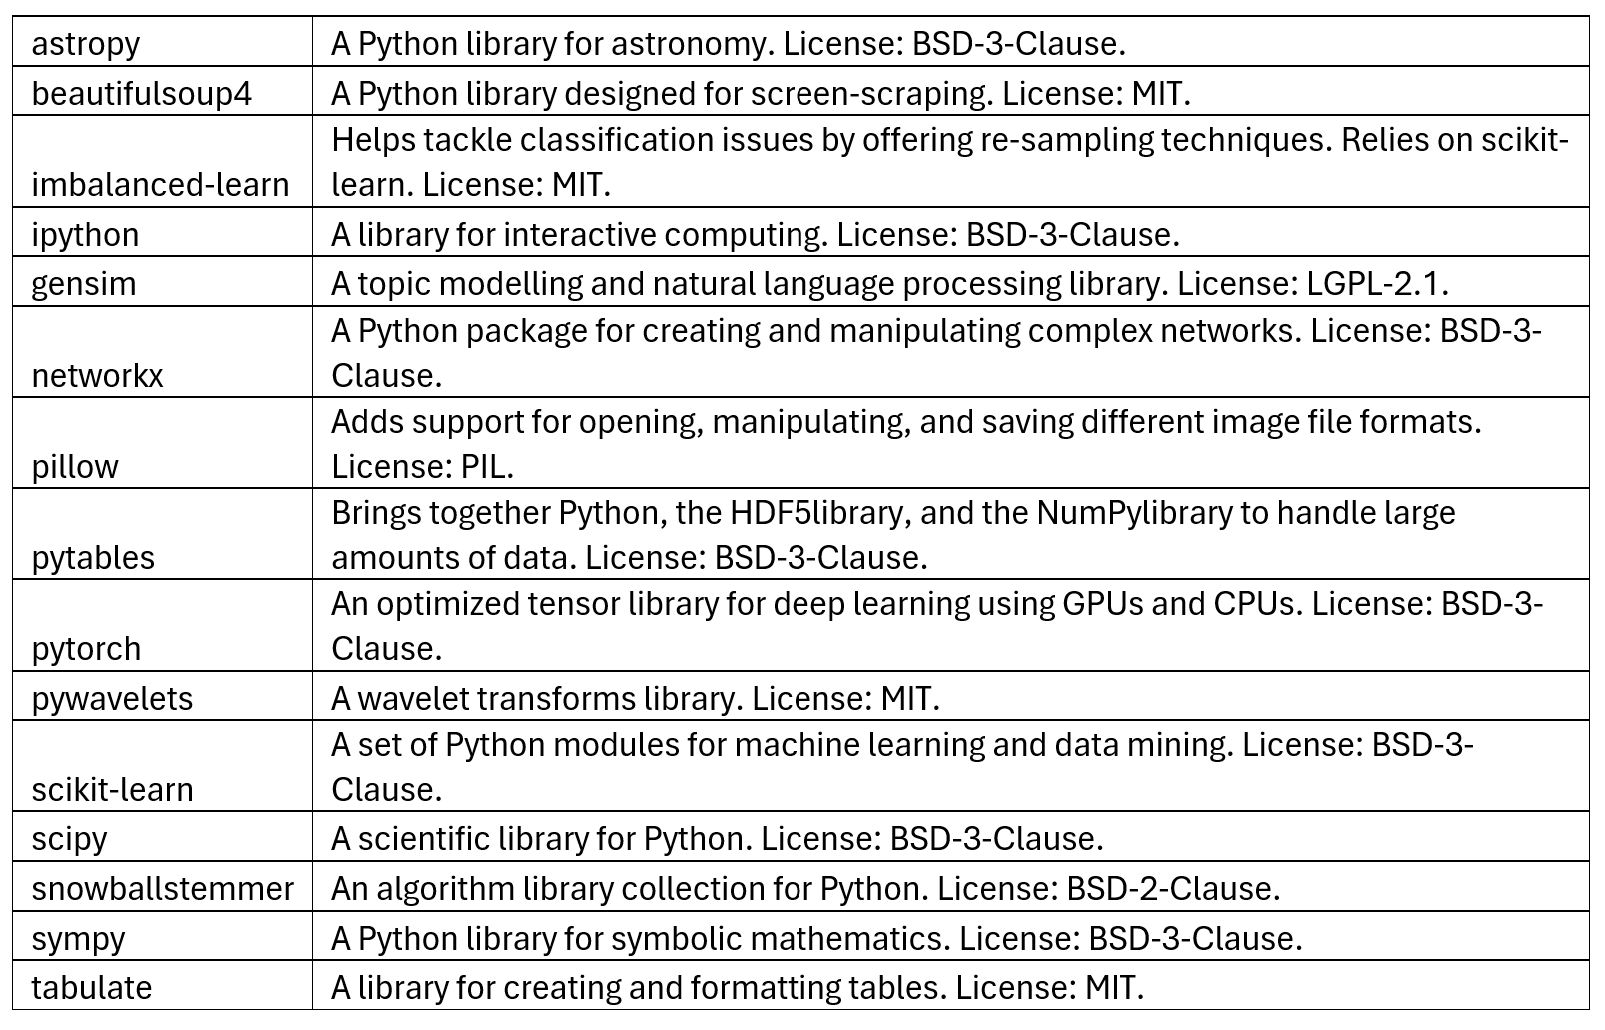
Other libraries available through Python in Excel include:
5. Clean & Analyze
Excel has traditionally struggled with data type classifications, confusing numbers, dates, and text vaguely hidden in the background of the data with clunky drop downs to reassign type. Using the cleaning tools available in Python libraries helps to compensate for these deficits within Excel, while also allowing the Python user access to benefits of Excel’s user and regex friendly Find-and-Replace tool.
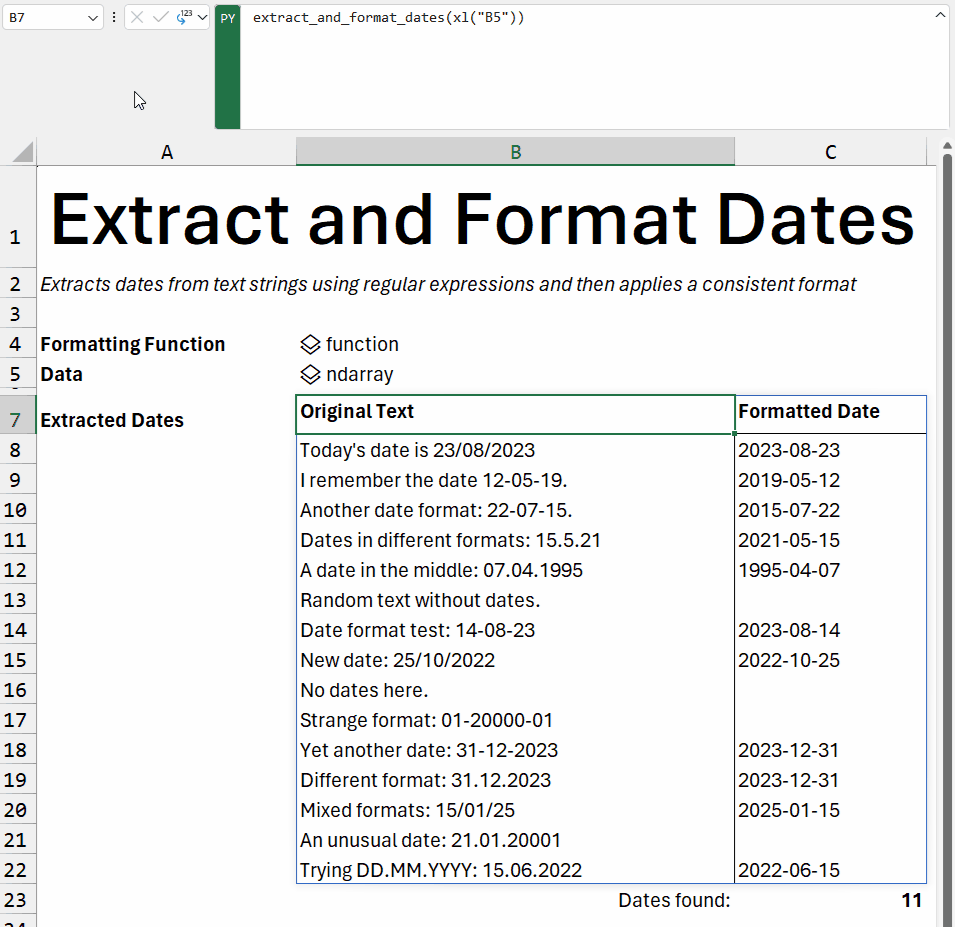
Cleaned data can then be analyzed within the sheet using your sharpest Python code and libraries. Your spreadsheet is now open to a world of fast analytics and statistical summaries without the hassle of jostling datasets between platforms.
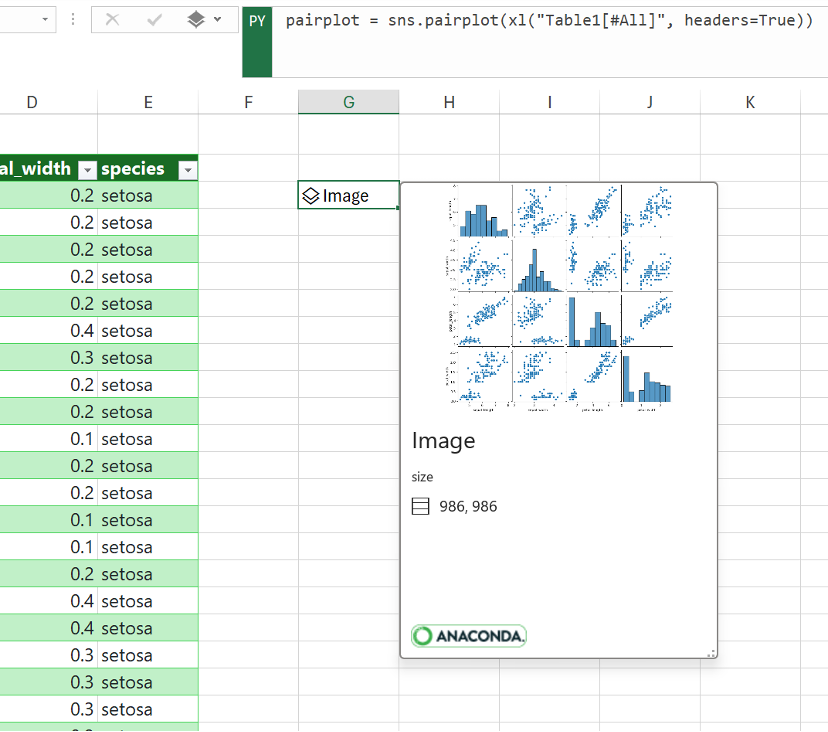
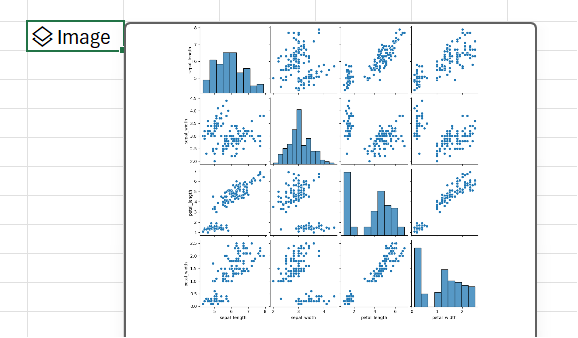
6. Visualize
To polish it all off, the new Python Integration allows direct access to visual libraries such as seaborn for deeper analytical graphs, while still allowing for visual tools provided by Excel such as Conditional Formatting and Pivot Tables.
pairplot = sns.pairplot(xl("Table1[#All]", headers=True))
7. Collaborate
Finally, because your company is using the Microsoft Teams ecosystem. You can collaborate with Sydney and even her Marketing Director in real time through commenting and version tracking.
8. Future for Excel and Data Folks
To be totally honest, the new Python Integration in Excel isn’t going to become your primary Data Science IDE. Excel just isn’t meant for Big Data.
However, the business world is compromised of far more small datasets. For our diligent Spreadsheet Queen, Sydney, the Python Integration in Excel opens up a richer world of analysis without requiring her to become a programmer so that in the future she potentially doesn’t need to tag you in for an unnecessary project.
For you as the data scientist, Excel acknowledges that when you need to tackle a million point database, you’re not going to come to them to handle it. However, Microsoft is seeking to make Excel a more powerful ETL tool for easier data pipelines, designed to pair with Microsoft Power Query for better a data aqcuisition process, as well as serving as the framework for the visualualization tools being innovated in Microsoft Power Bi.
Excel prejudice runs deep in the data community. But we invite you to set skeptism aside, keep your eyes peeled and heart open, then give the new Python Integration a try before reading in the next Excel file you’re handed to a different platform. You might just be surprised.